Analytics
About This Page
This page offers a transparent look at how visitors engage with my portfolio. Rather than keeping website metrics behind closed doors, I believe in open data — it reflects both my interest in analytics and my commitment to honest communication.
All data is sourced from Google Analytics 4 and represents the last 7 days. Everything shown here is fully aggregated. No personally identifiable information (PII) is collected, stored, or displayed — only anonymised patterns across all visitors combined.
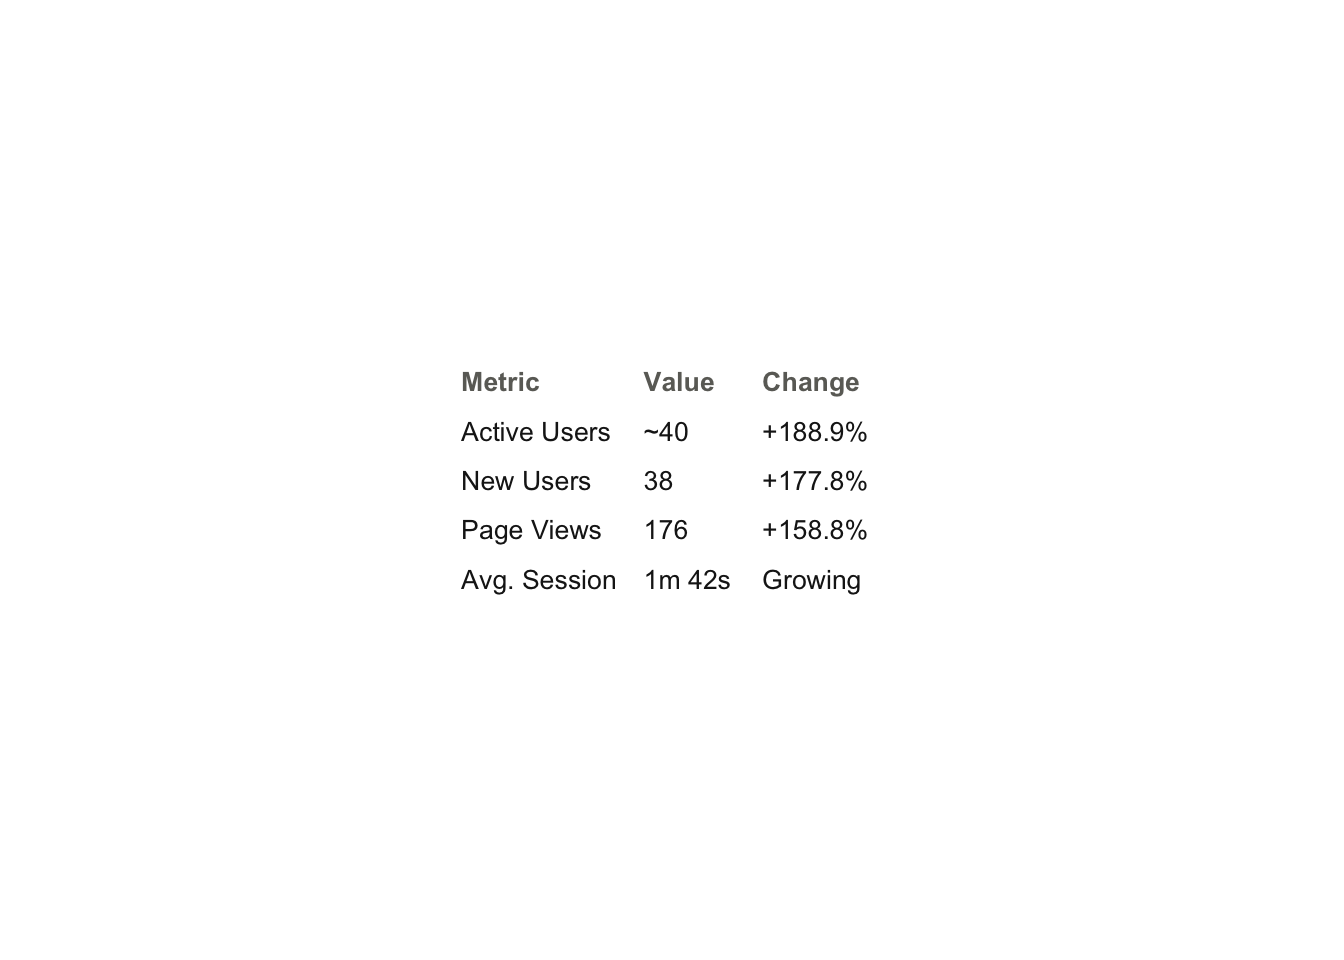
Snapshot: Last 7 Days
These four numbers give a quick pulse on recent site activity. The strong growth percentages reflect a recent uptick in traffic, likely driven by sharing the portfolio more actively across professional networks.
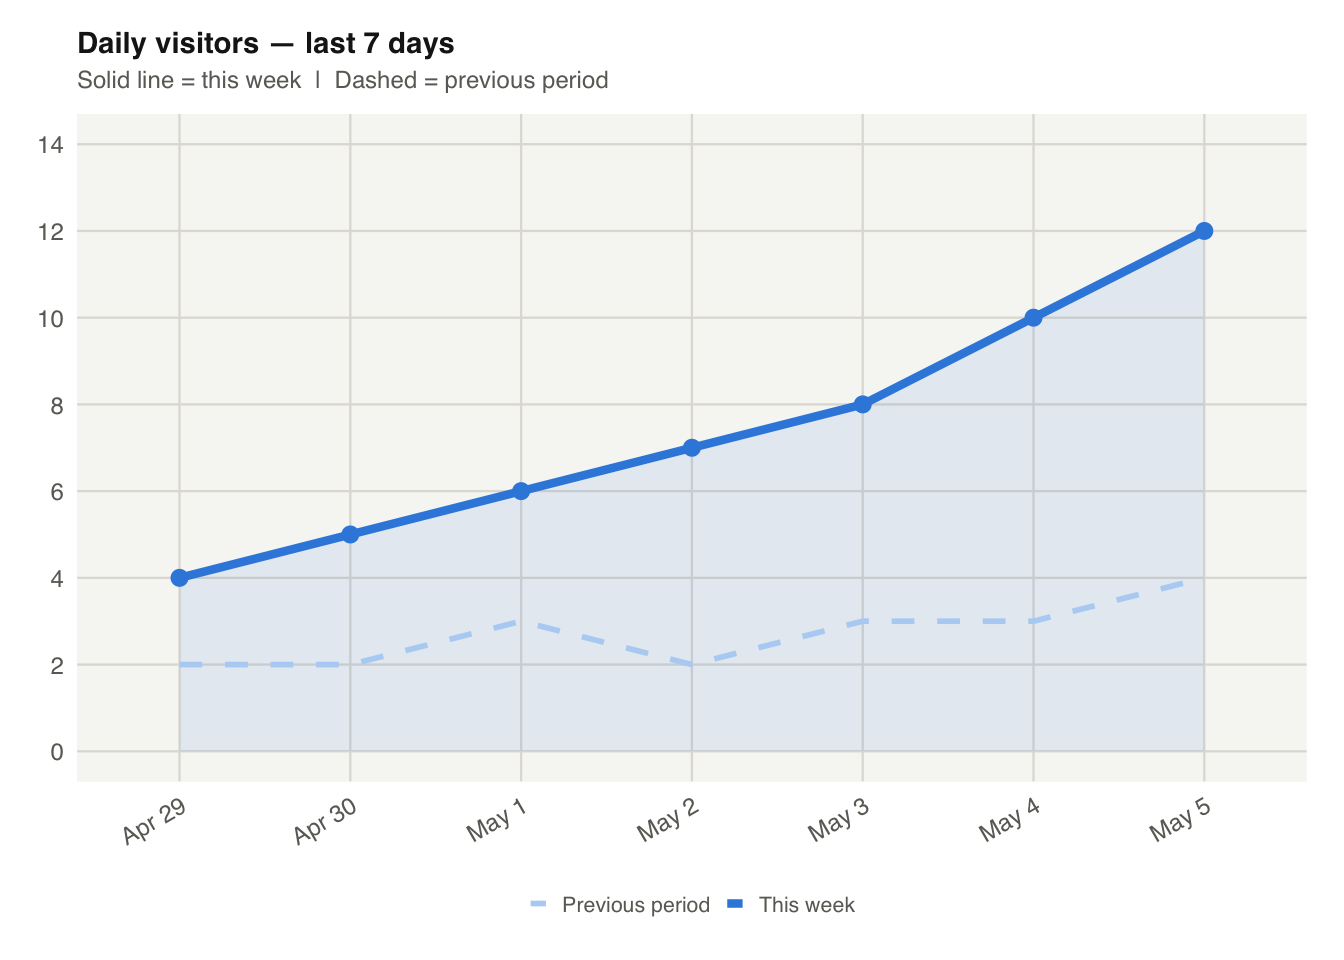
Visitor Trend
The chart below tracks daily unique visitors over the past week, compared against the previous period. The upward curve shows consistent growth day-over-day, with traffic nearly tripling by the end of the window.
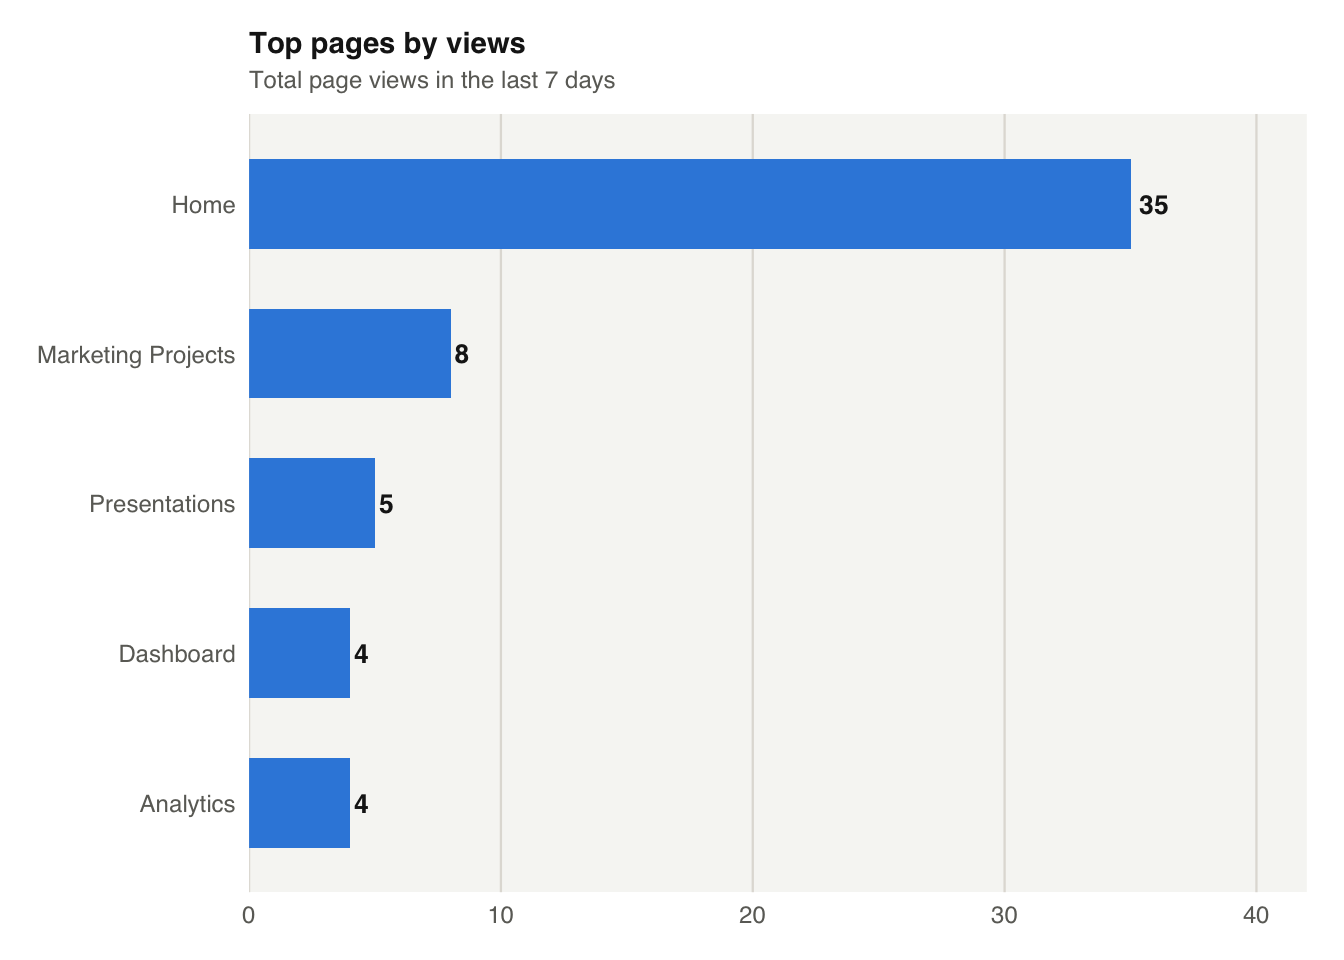
Where Visitors Are Going
The home page naturally leads in views as the entry point for most visitors. The strong showing for Marketing Projects suggests that recruiters and collaborators are actively browsing project work — which is exactly what this portfolio is designed for.
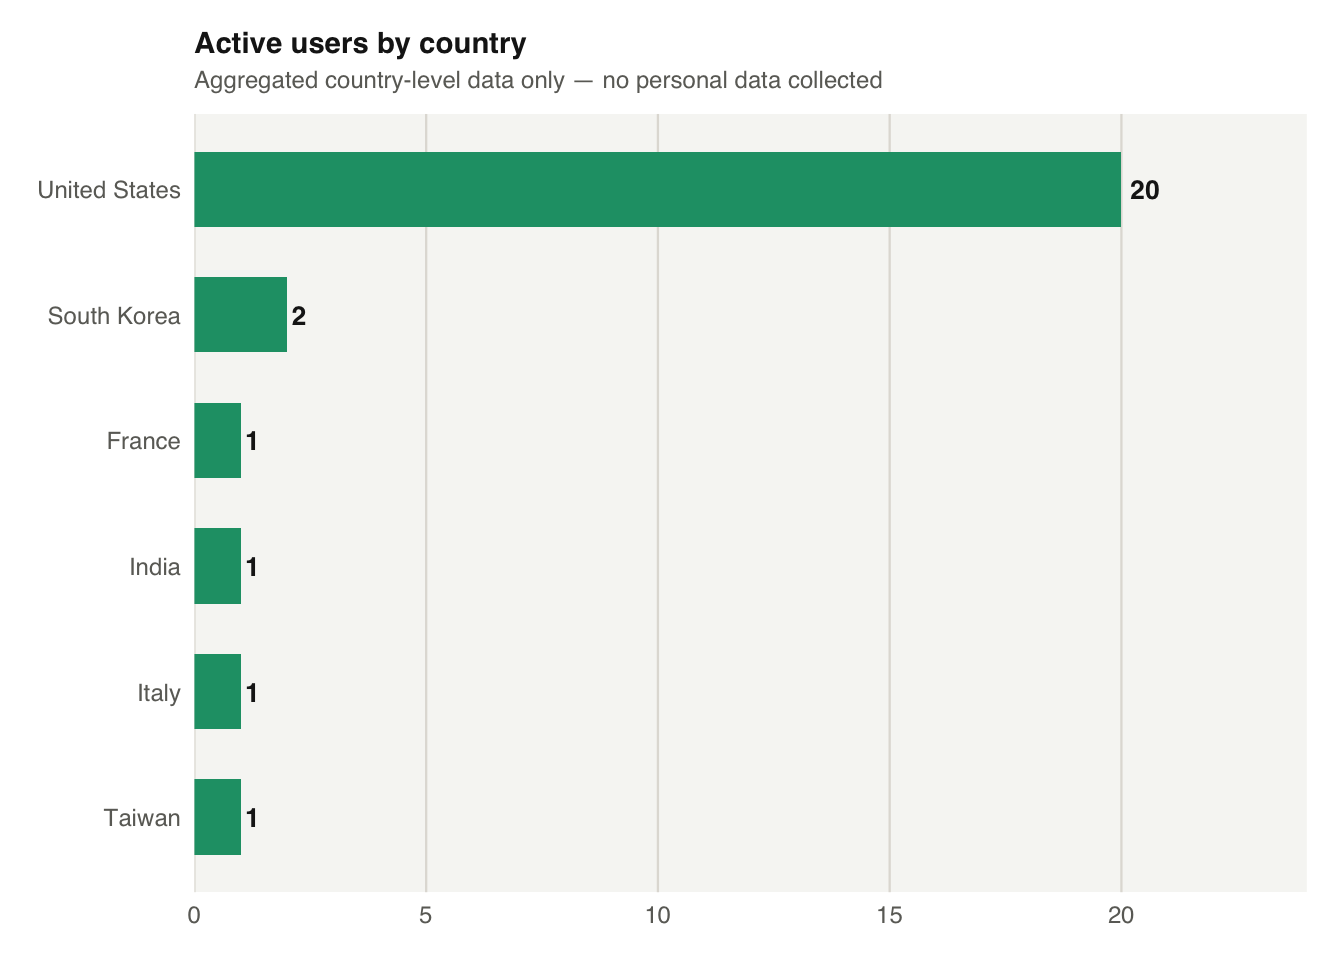
Global Reach
Traffic is coming from 7 countries, with the United States making up the majority of visits. The presence of visitors from South Korea, France, India, Italy, and Taiwan suggests the portfolio is reaching an international audience — something I’m actively working to grow.
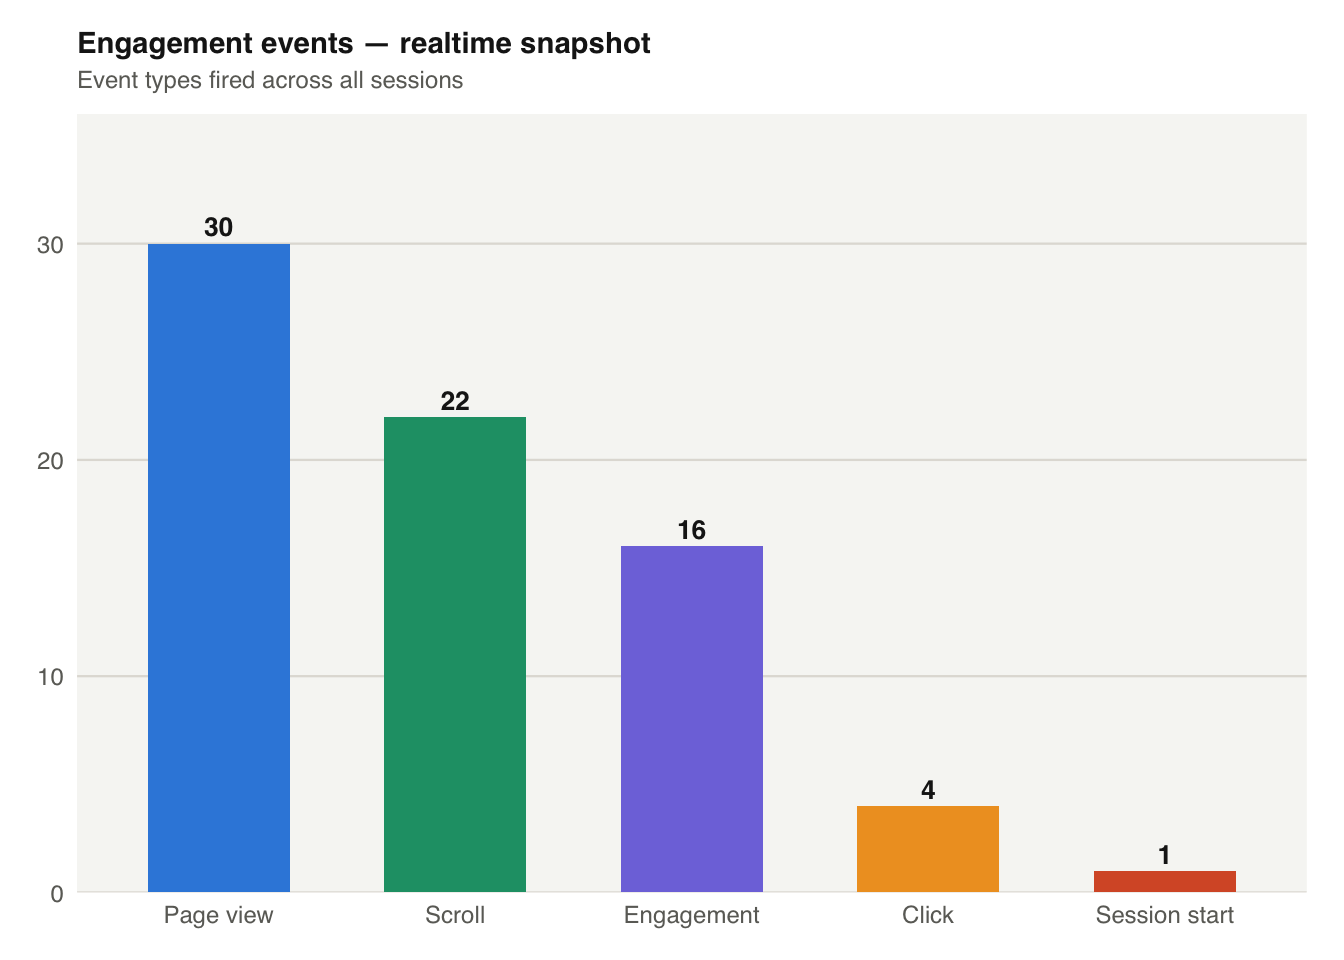
How People Engage
Beyond just page views, GA4 tracks behavioural signals. Scroll events (22) show visitors are reading content rather than bouncing immediately. User engagement events (16) confirm meaningful time is being spent on pages. The low click count (4) is something to watch — it may point to an opportunity to add clearer calls to action.
Privacy & Data Use
All analytics on this page are collected through Google Analytics 4 using anonymised, aggregated data only. No cookies that identify individual users are used. IP addresses are anonymised at collection. No data is sold or shared with third parties. This page is intended purely for transparency and to demonstrate real-world analytics skills.
Last updated: May 2026