Total Ad Spend
$48.2K
Total Revenue
$183.6K
Blended ROAS
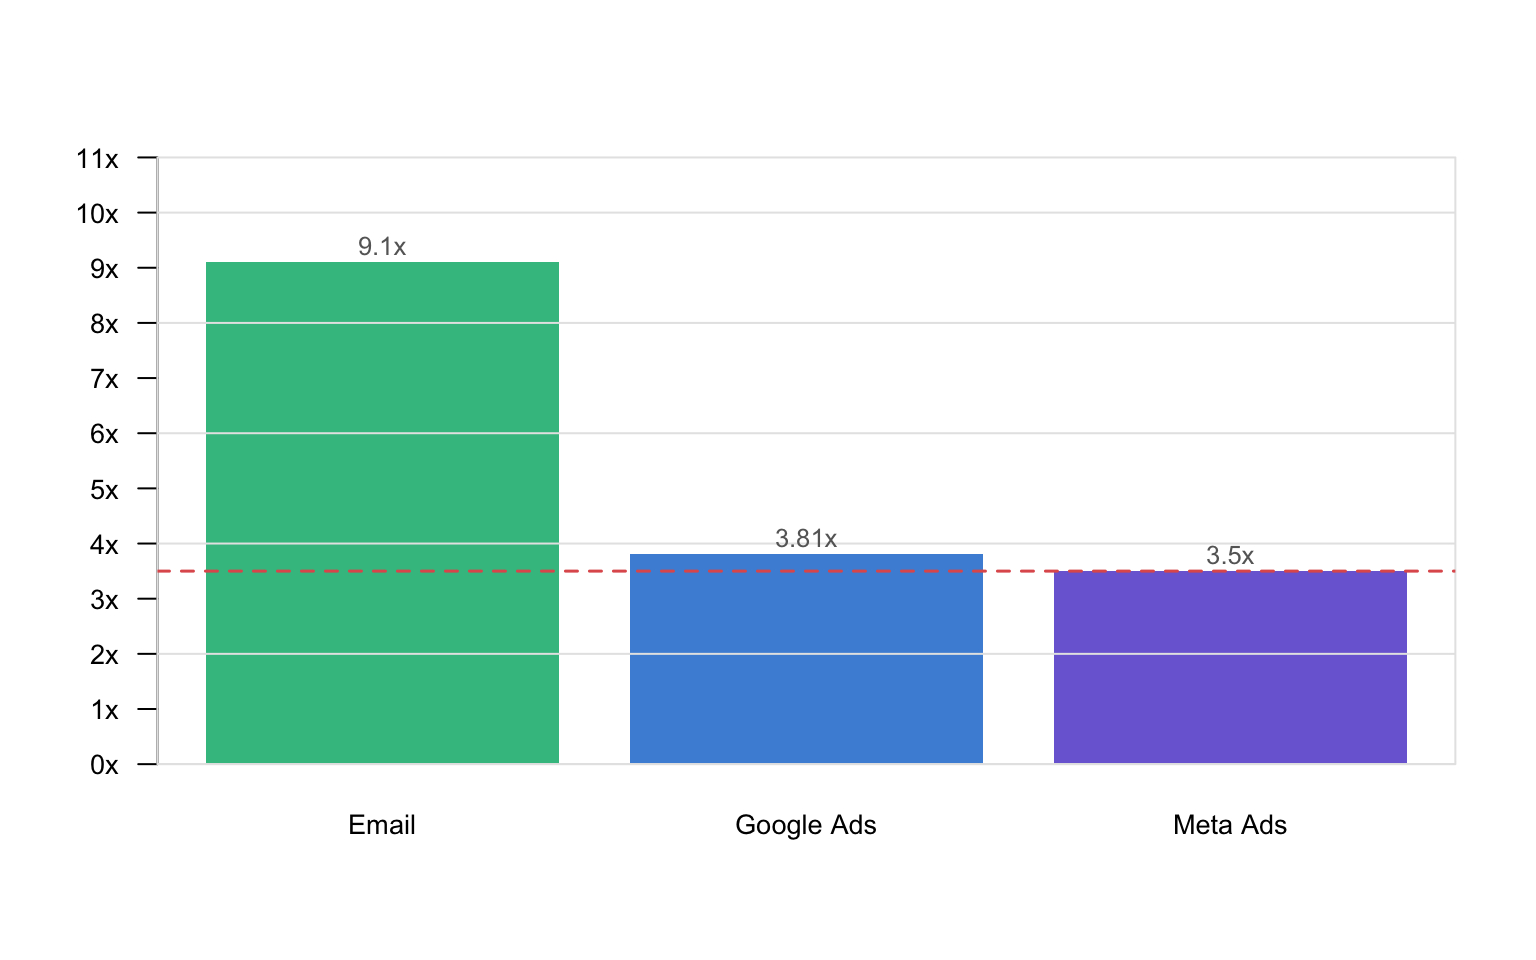
3.81x
Best Channel
Email 9.1x
Q1 2026 Campaign Overview — This dashboard analyzes digital marketing performance across Google Ads, Meta, Email, and SEO for Q1 2026. Total spend of $48.2K generated $183.6K in revenue, a blended ROAS of 3.81x. Email was the standout channel with a 9.1x return despite receiving only $4K in spend, while Google Ads drove the highest total revenue at $74.2K. These findings suggest reallocating budget toward email and optimizing Meta creative to improve overall portfolio efficiency.
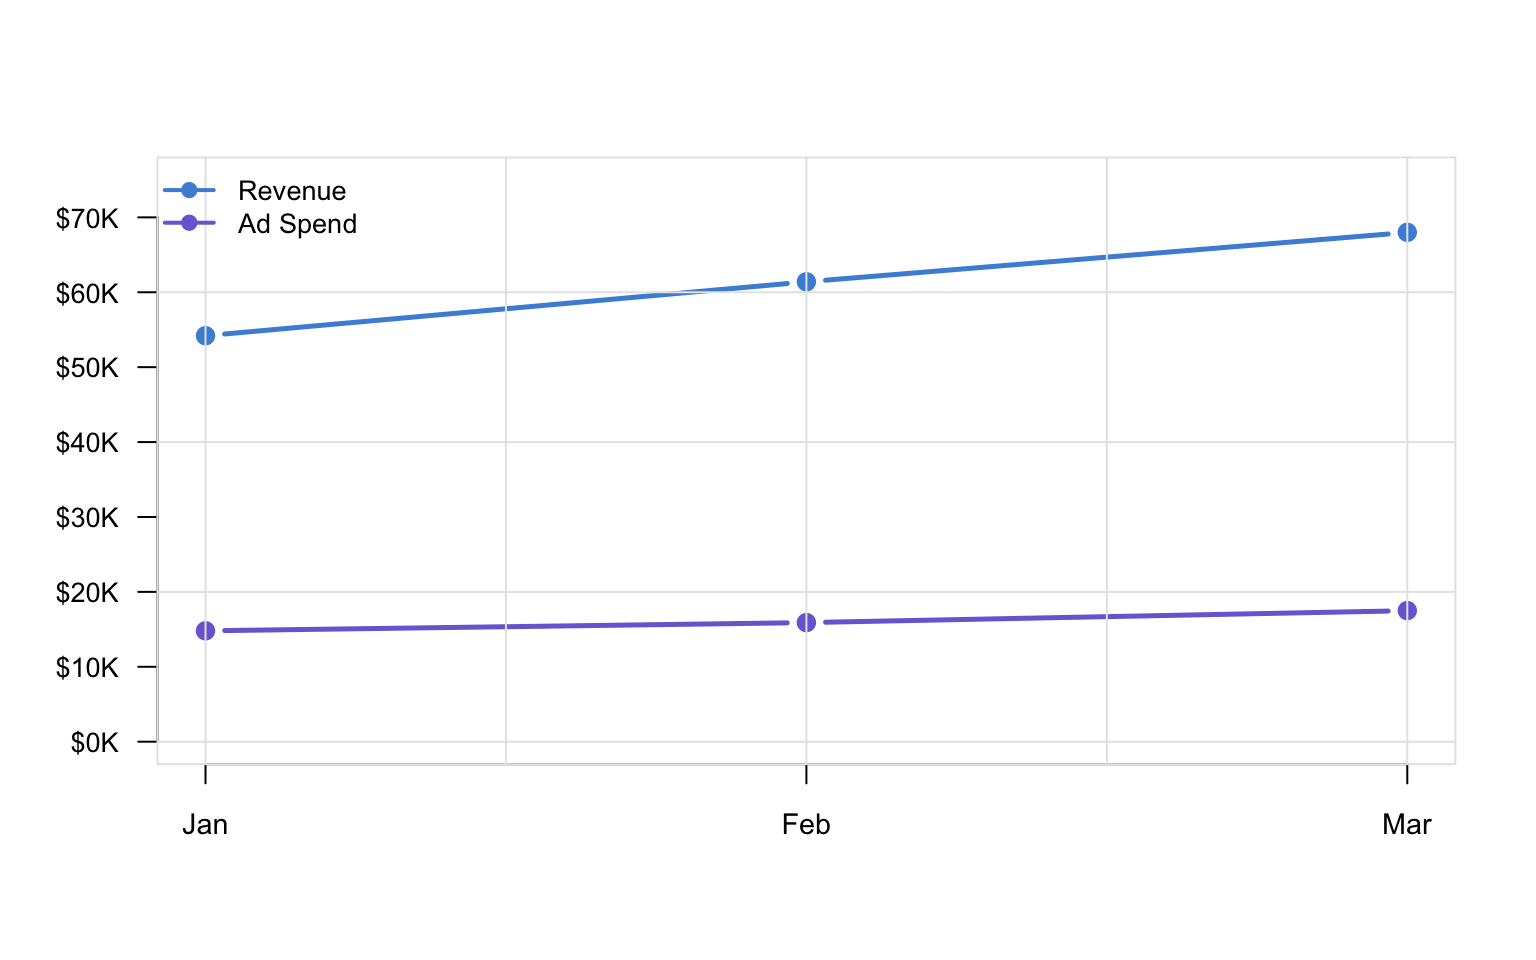
Monthly Spend vs Revenue — Revenue grew faster than spend each month, widening the gap through March.
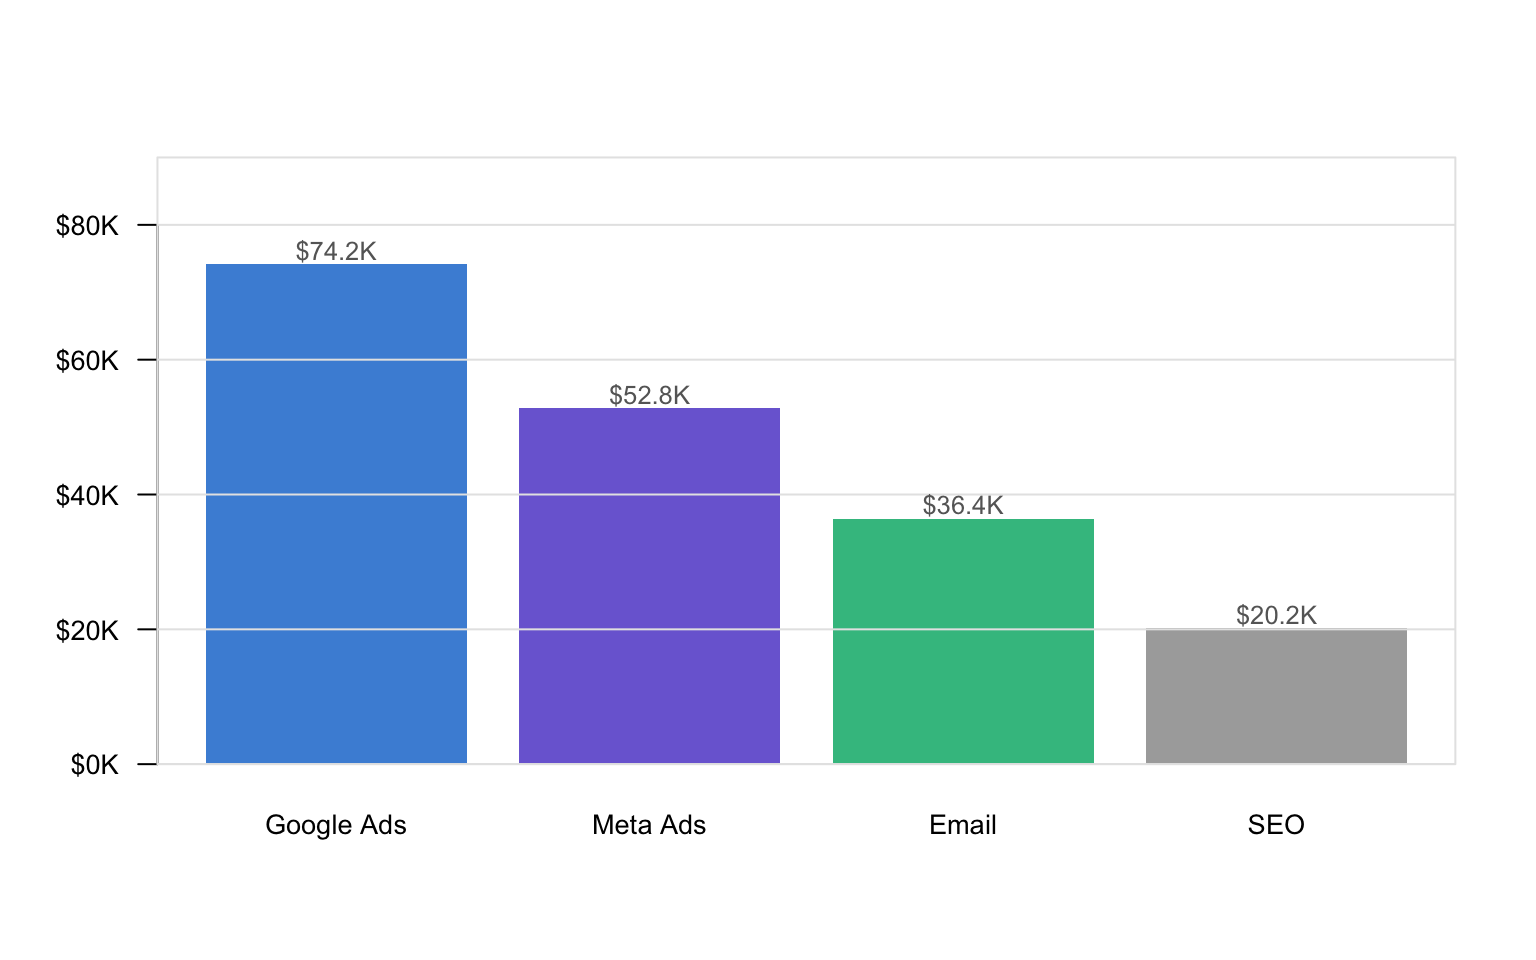
Revenue by Channel — Google Ads led in total revenue, but Email delivered the highest efficiency.
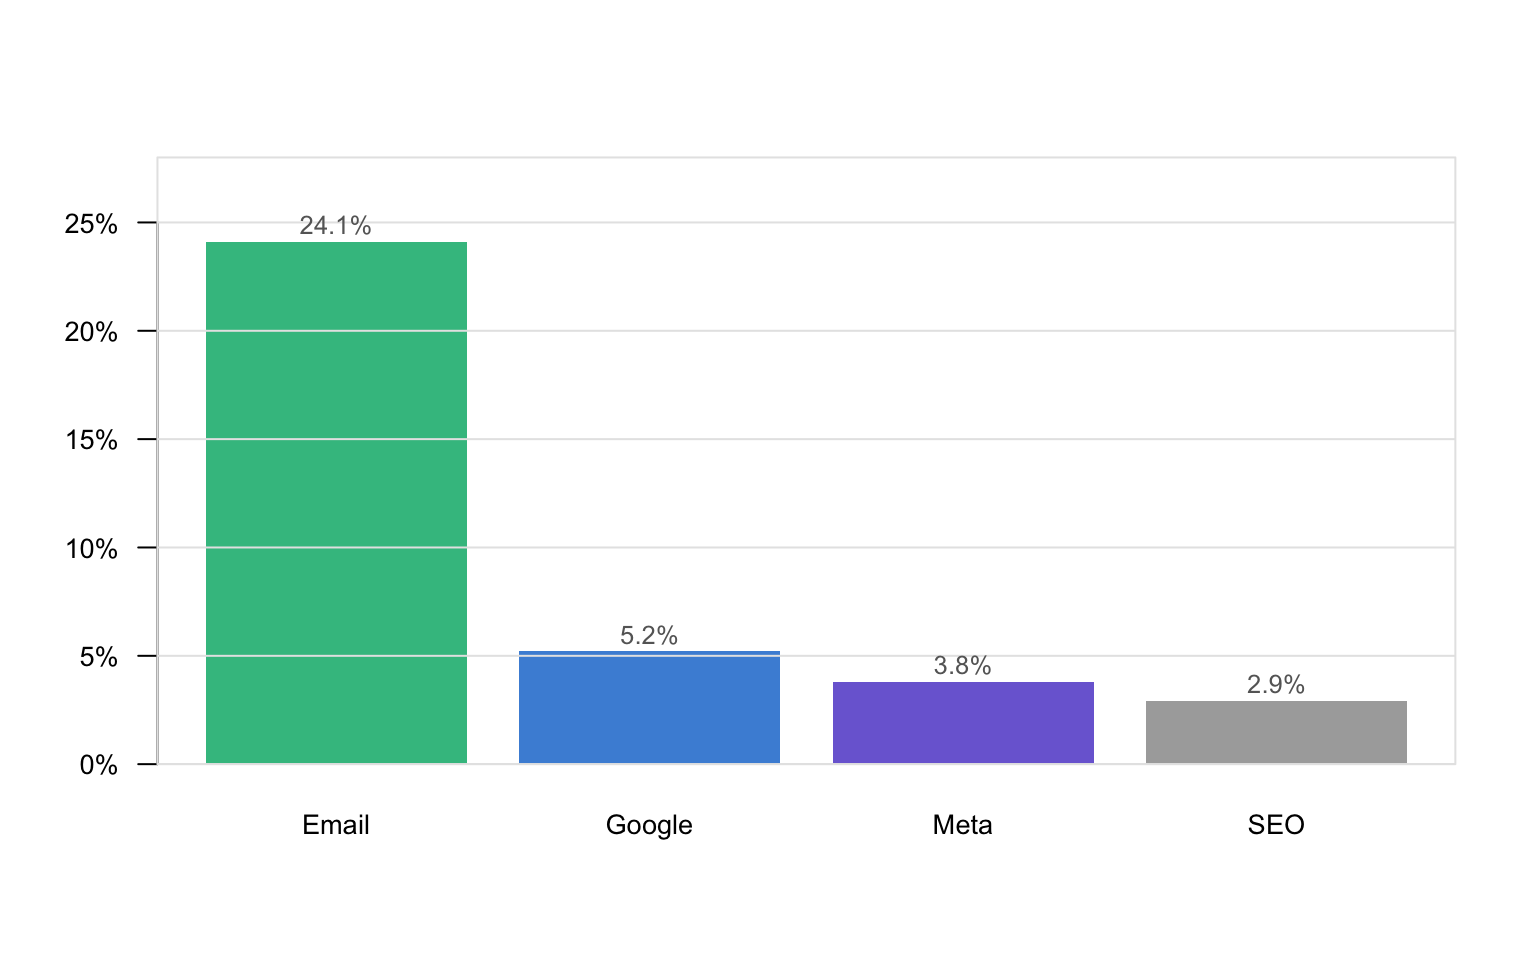
CTR by Channel — Email’s 24.1% CTR far outpaced paid channels, reflecting strong list quality.
ROAS by Channel — Red line marks the 3.5x efficiency threshold. Email well exceeds it.